- 17 Aug 2026
- Elara Crowthorne
- 0
Price charts get all the attention in crypto, but if you want to know which networks are actually building something lasting, you need to look at the code. Developer activity is the total volume of code commits, repository contributions, and active coding sessions across open-source blockchain projects. It’s the pulse check for any ecosystem. If developers stop showing up, the tech usually stagnates, no matter how high the token price climbs.
As we move through mid-2026, the landscape has shifted from the hype-driven spikes of earlier years to a more mature, infrastructure-focused phase. The data tells a story of consolidation rather than explosive growth. While the absolute number of builders remains high, the pace of new entrants has slowed. This isn't necessarily bad; it often means the ecosystem is maturing. Let’s break down who is still coding, where the effort is going, and what these numbers mean for the future of Web3.
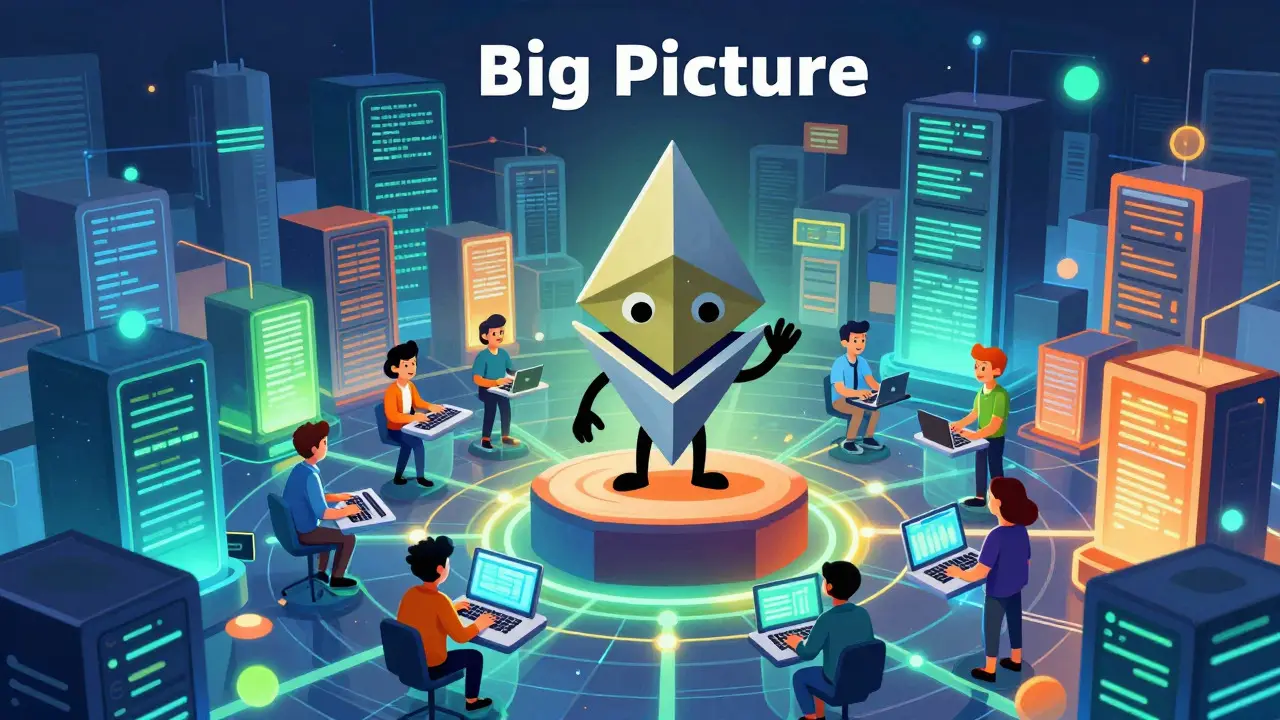
The Big Picture: Numbers Behind the Code
To understand the current state, we have to look at the most reliable data available. Electric Capital is a leading research firm that tracks blockchain developer activity by analyzing millions of code commits across open-source repositories. Their methodology filters out duplicates and bot activity, giving us a clean view of human contribution.
In their recent comprehensive analysis covering the period leading into 2025, they identified approximately 23,615 monthly active developers contributing to open-source cryptocurrency projects. This figure represents a slight dip from the previous year's peak of around 25,419. On the surface, a 7% decline might sound alarming. However, historical context matters here. Since Ethereum launched in 2015, the average annual growth rate for crypto developers has been roughly 39%. Fluctuations of 5-10% are normal market noise, not necessarily a sign of collapse.
What does this stability suggest? It suggests that the "easy money" era of hiring developers with free tokens is over. Now, developers stay because the tools work, the documentation is good, and the use cases are real. We are seeing a shift from speculative experimentation to practical application. The heartbeat of the blockchain space is slower but stronger.
Who Is Leading the Pack?
When you rank platforms by raw development events, a clear hierarchy emerges. Here is how the major players stacked up in the latest tracking periods:
| Platform | Monthly Development Events | Active Contributors | Trend Status |
|---|---|---|---|
| Ethereum | 82,800 | 1,300 | Dominant Leader (Slight Monthly Dip) |
| BNB Chain | 37,600 | 728 | Strong Second Place |
| Cosmos | 26,500 | 389 | Growing Contributor Base |
| Polygon | Data varies by month | Varies | High Volatility / Recent Decline |
| Arbitrum | Data varies by month | Varies | High Volatility / Recent Decline |
Ethereum continues to hold the crown. With nearly 83,000 development events, it dwarfs its competitors. Why? Because it’s the default. Most smart contract engineers learn Solidity first. The tooling ecosystem, including frameworks like Hardhat and Remix, is deeply integrated into the Ethereum stack. Even when monthly activity dips by 10%, the base is so large that it rarely loses its top spot.
BNB Chain sits firmly in second place. Its success is tied closely to Binance’s strategic push to lower transaction costs and attract developers who found Ethereum gas fees prohibitive. With 37,600 events, it’s not just a copycat; it has a distinct user base focused on high-throughput applications.
A surprising bright spot is Cosmos. While many Layer 2 solutions saw sharp declines of around 23% in certain measurement windows, Cosmos managed to grow its contributor base by 2.37%. This is significant. It indicates that developers are interested in interoperability and independent sovereign chains, not just scaling Ethereum.

Why Do Developers Move?
Developer migration isn't random. It follows specific incentives. Historically, capital flows drive engagement. During the DeFi explosion of 2021, developer activity in decentralized finance jumped by 50%. When there was money to be made in yield farming, coders showed up to build the interfaces and protocols.
Today, the drivers have changed. In Q1 2025 alone, startups in the blockchain space raised $3.8 billion across 220 deals. That’s more than double the investment seen in Q4 2024. Crucially, about 60% of this funding went toward infrastructure and DeFi projects, not just new token launches. This signals that investors are betting on the shovels, not just the gold.
Developers follow this funding. They look for:
- Grant Programs: Direct financial support for building specific features.
- Tooling Quality: How easy is it to deploy? Are the bugs frequent?
- Network Effects: Are other developers already there? Working in isolation is hard.
This is why Layer 2 Solutions like Arbitrum and Optimism remain critical. They solve the cost problem without requiring developers to rewrite their entire codebase. But the recent volatility in their developer counts suggests that competition is fierce. If a Layer 2 doesn’t offer unique value beyond cheaper fees, developers will leave for the next shiny object.
The Role of Analytics in Tracking Ecosystem Health
How do we know all this? Tools like Santiment play a massive role. Santiment tracks developer activity by monitoring code contributions and engagement levels across different blockchains. They don’t just count commits; they analyze the quality of interaction between developers and the network.
For instance, a single commit from a core maintainer carries more weight than ten commits from a script kiddie. Advanced analytics distinguish between "busywork" and meaningful progress. This granularity helps us see that while the total number of active developers might fluctuate, the core group of experts remains stable. These are the people who maintain the consensus mechanisms, fix critical security vulnerabilities, and upgrade the protocol.
If you are evaluating a blockchain project, ignore the marketing claims. Look at the GitHub repositories. Check the frequency of merged pull requests. See if the same few faces are consistently contributing or if it’s a revolving door of one-time contributors. The latter is a red flag for long-term viability.

What This Means for the Future
We are entering an era where developer activity is less about speculation and more about utility. The emergence of over 1,400 blockchain unicorns globally as of early 2025 shows that these companies are real businesses with revenue models, not just ideas. They need reliable infrastructure.
The focus is shifting toward cross-chain development and Web3 integration with traditional apps. Developers are no longer just building standalone dApps; they are integrating blockchain functionality into existing software stacks. This requires a higher level of engineering maturity. It’s harder work, which explains why the entry barrier for new developers has risen.
Regulatory clarity also plays a part. As major markets define rules for digital assets, developers feel safer committing their time to these ecosystems. Uncertainty drives talent away; clarity brings it back. The sustained high absolute numbers of active developers, despite market ups and downs, suggest that the underlying technology has earned its place in the software stack.
Frequently Asked Questions
What is the best metric for measuring developer activity?
The most reliable metric is the number of unique monthly active contributors to open-source repositories, adjusted for duplicate commits. Firms like Electric Capital use this method to filter out bots and ensure accurate counting. Raw commit counts can be misleading if a single developer makes thousands of trivial changes.
Is a decline in developer activity always bad?
Not necessarily. A moderate decline (5-10%) often reflects natural market cycles or the end of a specific hype cycle. What matters more is the retention rate of core developers. If the core team stays while casual contributors leave, the ecosystem is likely becoming more professional and stable.
Which blockchain has the most developers in 2026?
Ethereum remains the leader with approximately 1,300 active core contributors and over 80,000 monthly development events. BNB Chain follows with around 728 contributors. The gap between the first and second place is significant, highlighting Ethereum's entrenched position in the developer community.
How does funding affect developer engagement?
Funding provides the resources for grants, salaries, and infrastructure improvements. When venture capital flows into infrastructure projects, it attracts developers who need stable, well-funded environments to build. Conversely, when funding dries up, smaller projects may struggle to retain talent, leading to increased developer churn.
Why are Layer 2 solutions important for developers?
Layer 2 solutions like Arbitrum and Optimism allow developers to build scalable applications without leaving the Ethereum ecosystem. They reduce transaction costs significantly, making it feasible to build consumer-facing products. For developers, this means they can leverage Ethereum's security while offering users a better experience.
