- 2 Aug 2026
- Elara Crowthorne
- 0
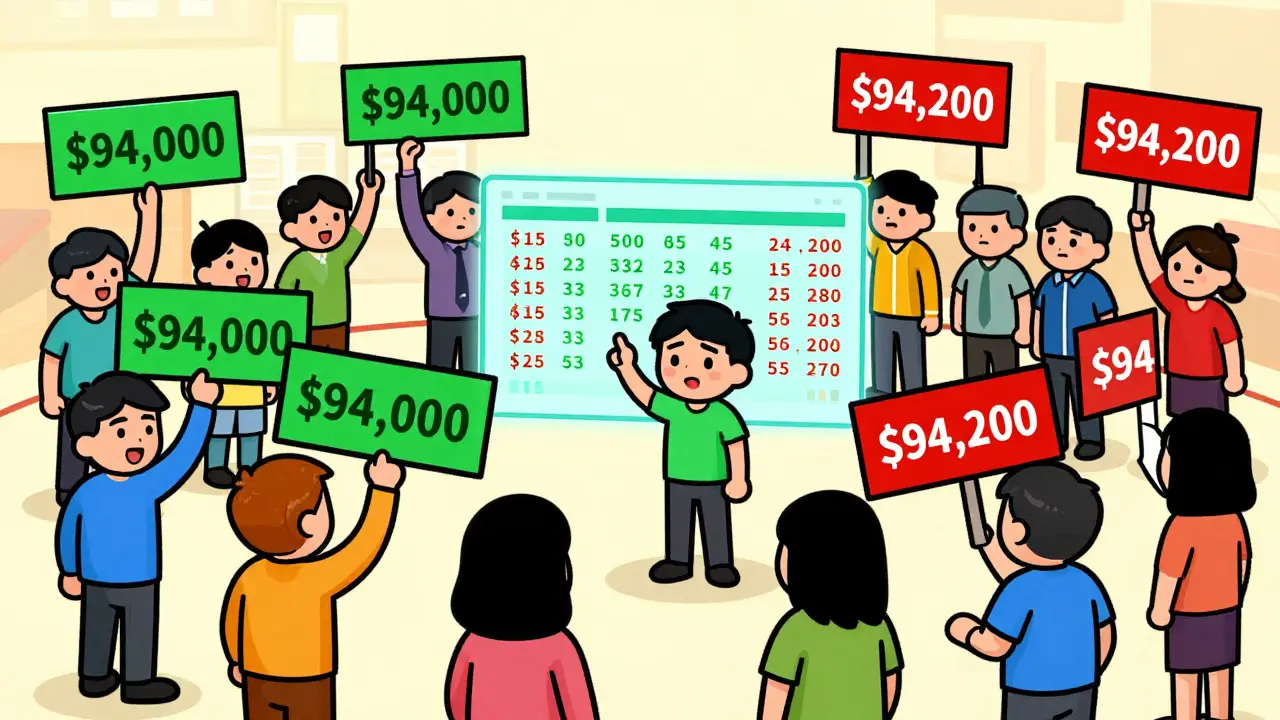
Imagine walking into a busy marketplace where everyone is shouting their prices. You want to buy an apple, but instead of one fixed price, you hear fifty different offers. Some people are willing to pay $1.05, others only $0.95. Sellers are screaming back with their own demands. This chaotic scene is exactly what happens in the digital world when you look at a crypto exchange order book.
If you are new to trading cryptocurrencies, staring at that wall of green and red numbers can feel overwhelming. It looks like code from a spy movie. But once you break it down, it is simply a list of what buyers want and what sellers demand. Understanding this tool is the difference between guessing where the price will go and knowing why it moved.
The Anatomy of the Order Book
At its core, an order book is a real-time electronic ledger. It displays every pending buy and sell order for a specific cryptocurrency pair, such as Bitcoin (BTC) against US Tether (USDT). Exchanges act as matchmakers here; they do not own the assets you trade. Instead, they provide the platform where your buy order meets someone else's sell order.
The visual layout is split into two distinct sides. On the left or top, you usually see the Bids. These are the buy orders. They are typically colored green because buying feels good. The highest bid sits at the very top, closest to the current market price. Below that, the prices drop lower. Why? Because buyers want to pay as little as possible. If I can buy Bitcoin for $94,000, why would I offer $94,100?
On the opposite side, you find the Asks. These are the sell orders, often displayed in red. The lowest ask appears at the bottom of this column, again, closest to the market price. Sellers want to get paid as much as possible, so the prices climb higher as you move up the list. If I can sell for $94,200, I won't settle for $94,100 if I don't have to.
In the middle, sandwiched between the best bid and the best ask, is the last traded price. This is the actual market value at this exact second. It changes constantly as trades execute.
Decoding the Numbers: Price, Amount, and Total
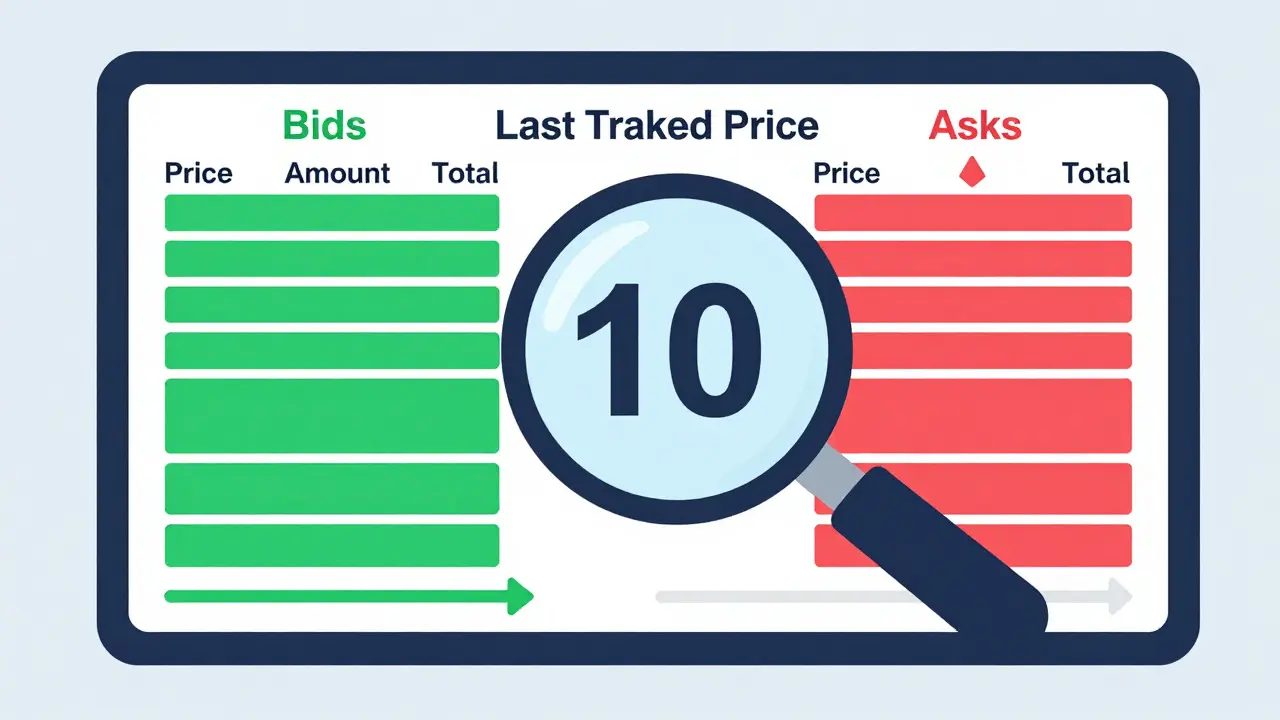
Each row in the order book contains three critical pieces of data. Let’s look at a hypothetical row on the Bid side:
- Price: $94,000. This is how much one unit costs.
- Amount: 2.5 BTC. This is how many units traders want to buy at that specific price.
- Total: $235,000. This is the cumulative value. It tells you the total money sitting behind that price level.
The Total column is crucial for spotting big players. If you see a small amount of BTC but a massive total value, it might indicate a large institutional player placing a significant order. For example, if ten traders each want to buy two Bitcoin at $94,000, the Amount shows 20 BTC, and the Total shows $1,880,000. This helps you understand the weight of the order.
Understanding the Bid-Ask Spread
One of the most important concepts to grasp is the Bid-Ask Spread. This is the gap between the highest price a buyer is willing to pay (Best Bid) and the lowest price a seller is willing to accept (Best Ask).
Let’s say the Best Bid for Ethereum is $3,000, and the Best Ask is $3,005. The spread is $5. This spread represents the cost of immediate liquidity. If you want to buy right now without waiting, you must pay the Ask price ($3,005). If you place a limit order at the Bid ($3,000), you wait for a seller to come to you.
A narrow spread, like $0.10 on a $100 asset, indicates high liquidity. There are many buyers and sellers close to each other. Your trades will execute quickly with minimal slippage. A wide spread suggests low liquidity. Fewer participants mean you might struggle to fill large orders without moving the price against yourself. Always check the spread before entering a trade on smaller, less popular coins.
Market Depth and Liquidity Walls
Looking at just the top line isn't enough. You need to see the Market Depth. This refers to the volume of orders available at various price levels below the best bid and above the best ask. Many exchanges display this as a depth chart-a jagged line graph that mirrors the order book.
Deep markets can absorb large trades without significant price impact. Imagine trying to push a heavy truck versus a bicycle. A deep order book is the truck; it takes a lot of force (buying or selling pressure) to move it. Shallow books are bicycles; a single large order can send the price skyrocketing or crashing.
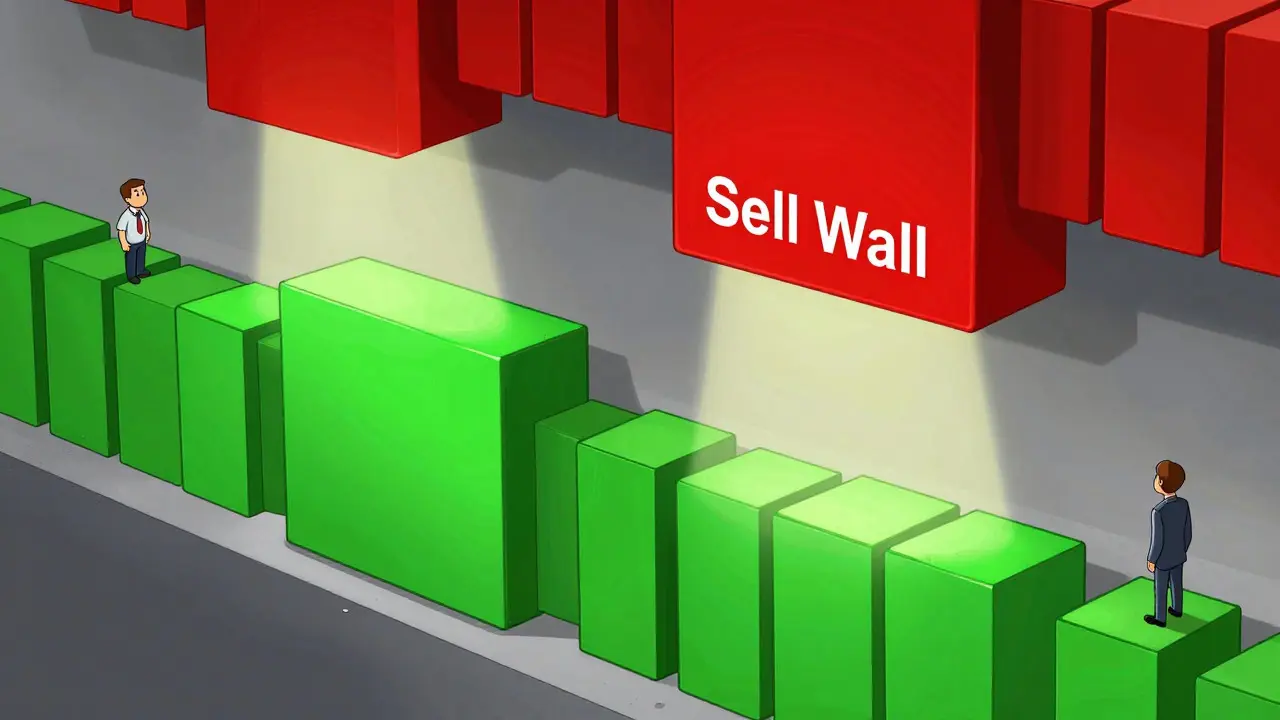
Traders look for "walls" in the order book. A buy wall is a massive accumulation of buy orders at a specific price level. For instance, if there is a $50 million buy order sitting at $90,000 for Bitcoin, it acts as support. It is hard for the price to drop below that level unless sellers overwhelm that $50 million. Conversely, a sell wall acts as resistance, capping the price upside.
Order Types: Market vs. Limit
How you interact with the order book depends on the order type you choose. The two primary types are Market Orders and Limit Orders.
A Market Order says, "I want to buy/sell right now at whatever the best available price is." When you submit a buy market order, the system instantly matches you with the lowest asks starting from the bottom up. If you want to buy 1 BTC and the top ask is 0.1 BTC at $94,000, the next 0.2 BTC at $94,001, and so on, you will eat through those levels until your full 1 BTC is filled. This guarantees execution but not price. In volatile markets, your final average price might be worse than you expected due to slippage.
A Limit Order says, "I will only buy/sell at this specific price or better." If you place a buy limit order at $93,500 when the market is at $94,000, your order goes into the book. It sits there in the green columns, waiting. It becomes part of the liquidity for other traders. If the price drops to $93,500, your order executes. This gives you price control but no guarantee of execution. The price might never reach your target.
Reading Sentiment and Spotting Manipulation
Experienced traders use the order book to gauge sentiment. Are more people piling up buy orders at lower prices? That suggests bullish confidence. Is there a thinning of bids while asks remain thick? That hints at potential downward pressure.
However, beware of spoofing. Sometimes, large traders place huge fake orders far from the market price to create the illusion of support or resistance. They might put a massive buy wall at $90,000 to make retail traders think the price won't drop, encouraging them to buy. Then, just before the price hits that wall, they cancel the order. The price plummets. Always watch for rapid cancellations and changes in the book structure.
| Concept | Definition | What It Tells You |
|---|---|---|
| Bid Side | List of pending buy orders | Demand strength and support levels |
| Ask Side | List of pending sell orders | Supply pressure and resistance levels |
| Spread | Difference between best bid and ask | Liquidity and transaction cost |
| Depth | Volume of orders at various prices | Market stability and slippage risk |
| FIFO | First-In, First-Out principle | Execution priority among same-price orders |
Practical Steps to Start Reading the Book
You don't need to become a professional quant overnight. Start with these simple steps:
- Identify the Columns: Confirm which side is Bids (green/buy) and which is Asks (red/sell). Note the color coding of your specific exchange.
- Check the Spread: Look at the gap between the top bid and bottom ask. Is it tight? If you are trading a major pair like BTC/USDT, it should be fractions of a cent. If it's wide, consider if the coin is too illiquid for your strategy.
- Scan for Walls: Look down both sides. Are there any rows with significantly larger amounts than the surrounding ones? Mark these mentally as potential support or resistance zones.
- Observe Flow: Watch how the top lines change. Are bids being eaten away rapidly? That means aggressive buying. Are asks disappearing? That could signal panic selling or strong absorption by buyers.
- Use Depth Charts: Toggle the depth chart view if available. It smooths out the noise and makes it easier to see the overall balance of supply and demand visually.
Remember, the order book is a snapshot of intent, not action. Orders can be canceled in milliseconds. Do not rely on it as a crystal ball. Use it as a map of the current battlefield. Combine it with price action charts and volume indicators for a complete picture.
By mastering the basics of the order book, you stop being a passive participant and start understanding the mechanics driving the market. You will know why a price jumped, where the hidden resistance lies, and how to place your orders more intelligently to save on fees and slippage.
What does the green side of the order book represent?
The green side represents the Bids, which are buy orders. Traders on this side are willing to purchase the cryptocurrency at the listed prices. The highest bid is always at the top, closest to the current market price, indicating the strongest demand.
Why is the bid-ask spread important for traders?
The bid-ask spread indicates liquidity and trading costs. A narrow spread means high liquidity, allowing for quick executions with minimal price impact. A wide spread suggests low liquidity, meaning you may pay more to buy or receive less when selling immediately.
What is a limit order versus a market order?
A market order executes immediately at the best available current price, guaranteeing speed but not price. A limit order sets a specific price at which you are willing to buy or sell. It guarantees price but not execution, as the market may never reach your specified level.
How can I identify support and resistance using the order book?
Look for large clusters of buy orders (buy walls) below the current price, which act as support, making it harder for the price to fall. Similarly, large clusters of sell orders (sell walls) above the current price act as resistance, capping upward movement.
What is market depth and why does it matter?
Market depth shows the volume of buy and sell orders at different price levels. Greater depth indicates higher liquidity, meaning large trades can be executed without causing significant price slippage. Shallow depth increases the risk of price volatility during large transactions.
Can order book data be manipulated?
Yes, through practices like spoofing. Traders may place large fake orders to create false impressions of supply or demand, influencing other traders' behavior. These orders are often canceled before execution. Always monitor for rapid order cancellations.