- 9 Sep 2026
- Elara Crowthorne
- 0
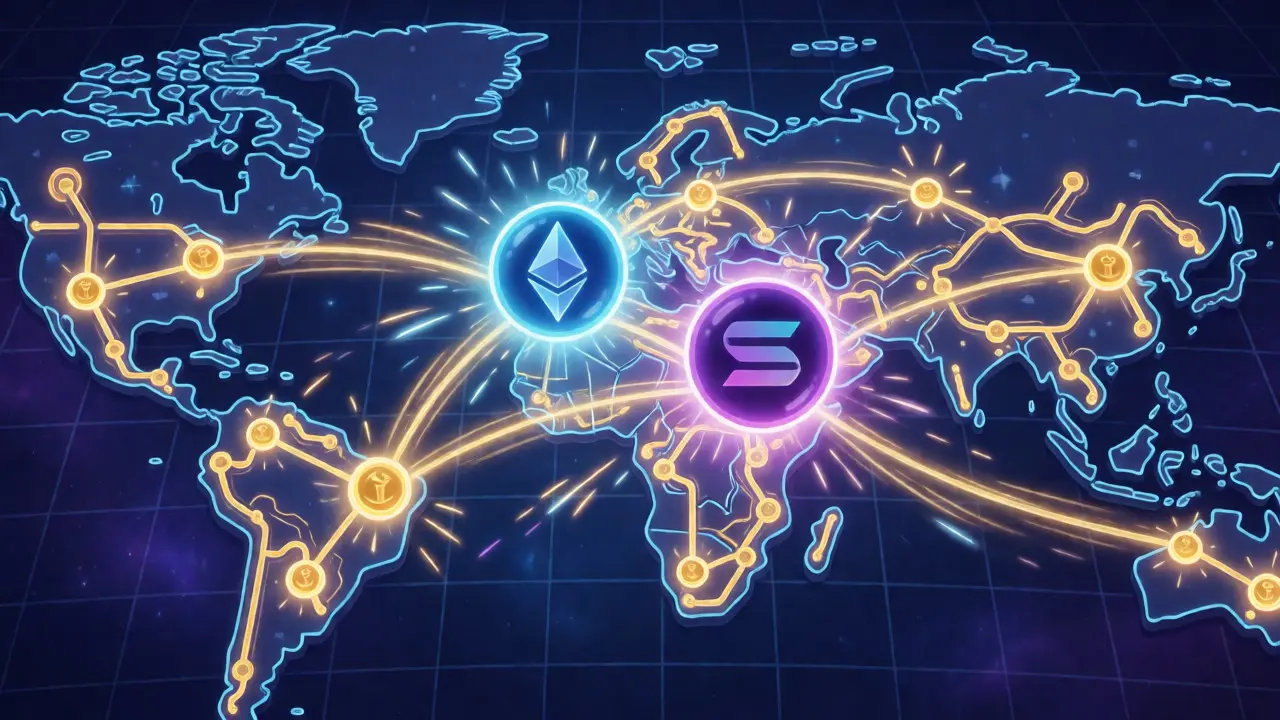
Imagine you’re looking at a map of the global financial system, but instead of bank branches, you see glowing nodes where billions of dollars in digital assets are parked. That’s what Total Value Locked (TVL) represents: the aggregate value of cryptocurrency assets deposited into decentralized finance protocols across various blockchain networks. It’s not just a vanity metric; it’s the pulse check for on-chain liquidity and investor confidence. As of late 2025 and heading into 2026, understanding how this wealth is spread out tells you more about the health of the ecosystem than any single price chart ever could.
Why does this matter to you? Because TVL isn’t evenly distributed. It’s concentrated, shifting, and often misleading if you don’t know how to read it. Ethereum still holds the crown, but challengers like Solana and emerging Layer-2 solutions are carving out significant territories. If you’re an investor, developer, or just curious about where the money is actually going, you need to look past the headline numbers and understand the mechanics driving these flows.
The Current State of On-Chain Wealth
Let’s get concrete. The global DeFi market has grown massively since the early days. In early 2022, total TVL hovered around $25 billion. By March 2025, that number had surged past $100 billion, marking a 300% increase. This growth wasn’t accidental; it was driven by institutional adoption and better infrastructure. According to data from CoinGecko, three networks-Ethereum, Solana, and Tron-collectively controlled over 68% of the entire market share as of October 2025.
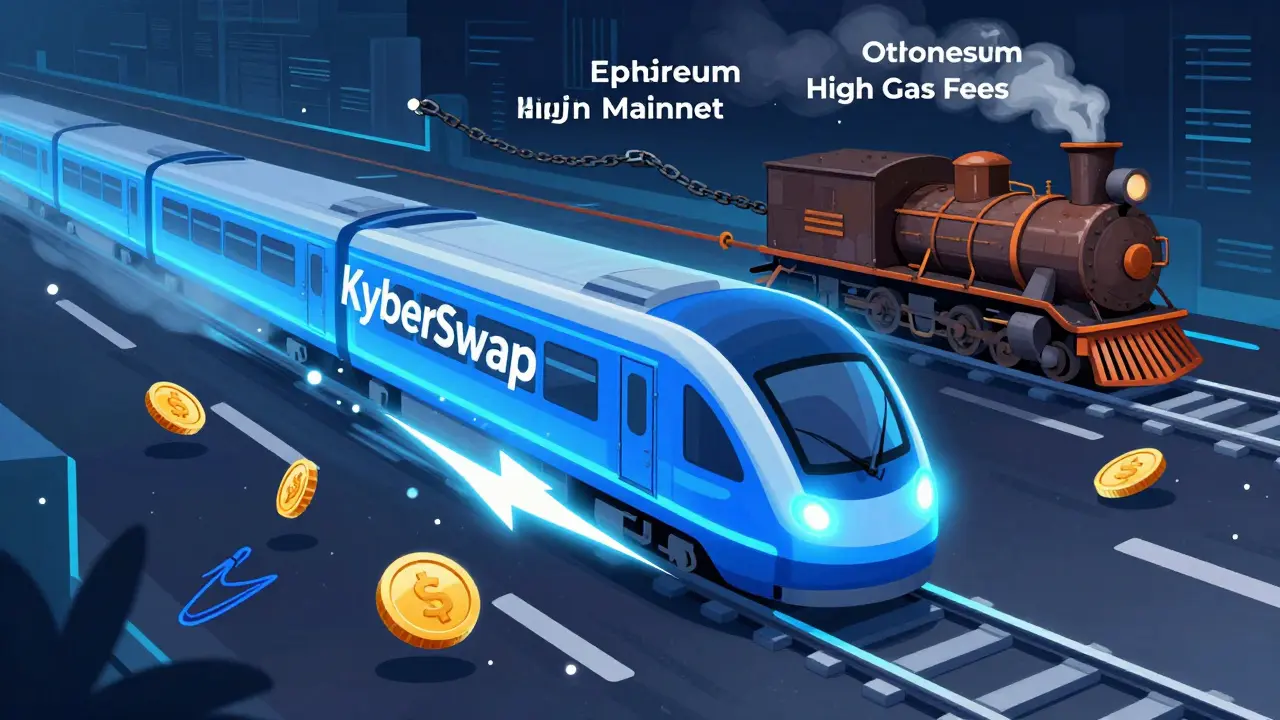
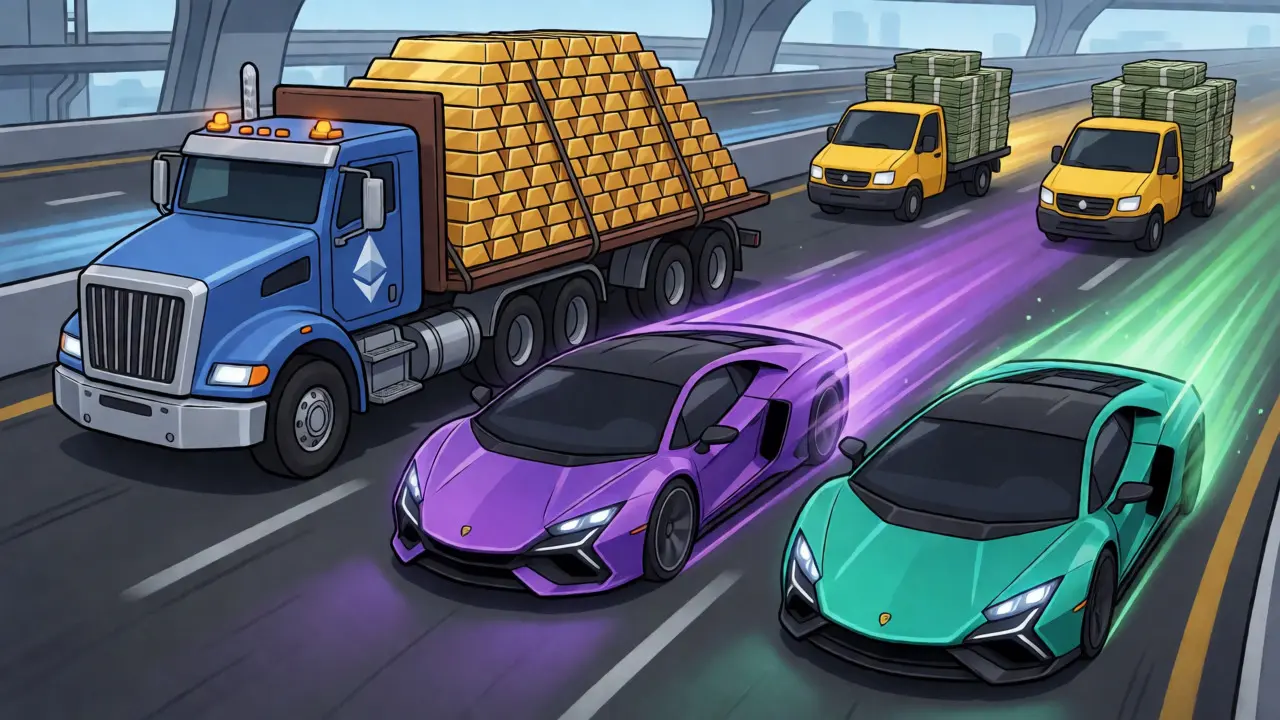
Ethereum remains the heavyweight champion with approximately $42.5 billion in TVL, accounting for roughly 41% of the total. But here’s the twist: its dominance is being tested. While Ethereum offers unmatched security and a massive developer ecosystem, high gas fees (averaging $1.85 per transaction during peak times) push users toward cheaper alternatives. This dynamic creates a tug-of-war between security and cost-efficiency that defines much of today’s TVL distribution.
Major Contenders and Their Niches
If Ethereum is the fortress, Solana is the speedway. With $18.7 billion in TVL, Solana captures about 18% of the market. Its appeal lies in transaction finality measured in seconds rather than minutes, and fees that are fractions of a cent ($0.00025 average). This makes it ideal for high-frequency trading apps and gaming protocols where waiting for block confirmation kills the user experience. However, Solana’s history of network outages keeps some conservative capital away, despite its technical prowess.
Then there’s BNB Smart Chain (BSC), holding $12.3 billion. BSC occupies a middle ground: faster than Ethereum, more decentralized than some newer chains, but with only 41 validator nodes compared to Ethereum’s thousands. It sacrifices some decentralization for speed and lower costs, making it popular for retail-focused DeFi apps and meme coin ecosystems.
Don’t overlook TRON. Often dismissed by Western-centric analysts, TRON commands $6.3 billion in TVL, largely because it dominates stablecoin transfers in Asia. About 98% of its TVL is tied up in USDT. This specialization makes it incredibly efficient for cross-border payments but also vulnerable; when USDT faced depegging fears in August 2024, TRON’s TVL dropped by nearly 16%. It’s a reminder that concentration risk cuts both ways.
The Rise of Layer-2 Solutions
Perhaps the most significant shift in TVL distribution is the migration to Layer-2 (L2) networks. These are scaling solutions built on top of Ethereum that offer lower fees while inheriting Ethereum’s security. Collectively, L2s now represent nearly 23% of Ethereum’s total TVL.
Arbitrum is the leading Layer-2 solution, capturing 11.3% of Ethereum's TVL with $12.1 billion locked. It appeals to developers who want EVM compatibility without the mainnet congestion. Optimism follows closely with $8.4 billion, leveraging its strong ties to the Coinbase ecosystem. Base, Coinbase’s own L2, has seen explosive growth, reaching $5.45 billion TVL with a 12.2% quarterly increase. Why the surge? Simple: ease of use. For many users, bridging from a Coinbase account to Base is seamless, removing friction that previously kept casual investors off-chain.
| Network | TVL (USD) | Market Share (%) | Primary Use Case | Avg Transaction Fee |
|---|---|---|---|---|
| Ethereum Mainnet | $42.5 Billion | 41.2% | Institutional DeFi, High-Security Vaults | $1.85 |
| Solana | $18.7 Billion | 18.2% | High-Frequency Trading, Gaming | $0.00025 |
| BNB Smart Chain | $12.3 Billion | 12.0% | Retail DeFi, Meme Coins | $0.10 - $0.50 |
| Arbitrum | $12.1 Billion | 11.7% | EVM Scaling, Complex DApps | $0.01 - $0.10 |
| TRON | $6.3 Billion | 6.1% | Stablecoin Transfers (USDT) | $0.00 - $0.05 |
| Base | $5.45 Billion | 5.3% | Coinbase Integration, SocialFi | $0.01 - $0.05 |
How to Spot Artificial TVL
Here’s where things get tricky. Not all TVL is created equal. Some protocols inflate their numbers through "TVL-inflationary mechanisms." Nic Carter from Castle Island Ventures pointed out that up to 37% of reported TVL in some audits was illusory, resulting from double-counting or artificial liquidity pools. Imagine a protocol offering a 100% APY reward token. Users deposit funds solely to farm those rewards, then dump them immediately. The TVL spikes, but the underlying economic activity is hollow.
Delphi Digital identified three types of TVL growth patterns:
- Organic Growth: Steady 2-5% monthly increases driven by genuine utility.
- Incentive-Driven: Spikes of 15-30% monthly, often followed by sharp drops once rewards end.
- Artificial Growth: Explosive 50%+ monthly jumps with rapid decay, usually signaling unsustainable farming.
When evaluating a new chain or protocol, look beyond the raw TVL number. Check the revenue metrics. Does the protocol generate actual fees from usage, or is it paying users to stay? Aave, for example, maintains steady organic growth because people use it for real borrowing needs, not just yield farming.
Regional and Institutional Influences
TVL distribution isn’t just about technology; it’s about geography and regulation. Asia-Pacific accounts for 39% of TVL growth, heavily influenced by TRON’s popularity in China and Southeast Asia. North America represents 32%, dominated by Ethereum and Solana. Regulatory frameworks play a huge role here. The EU’s MiCA regulations caused a temporary 12.4% dip in TVL across affected networks in Q2 2025 as protocols scrambled to comply. But compliance brings stability, and TVL rebounded quickly afterward.
Institutional investors are also reshaping the landscape. JPMorgan’s research team noted a 0.87 correlation between TVL and protocol survival rates during downturns. This means big money uses TVL as a safety filter. Fidelity allocated 7.3% of client assets to DeFi protocols by Q3 2025, primarily targeting Ethereum and regulated Layer-2s. They aren’t chasing the highest yields; they’re chasing depth of liquidity and proven track records.

Emerging Chains and Future Trends
While the giants dominate, smaller chains are finding niches. Provenance Network saw a 44% surge in TVL, and XDC Network experienced massive growth in specific protocols like Curve Finance. These chains often target specific verticals, such as supply chain finance or identity verification. Bernstein analysts predict that by 2027, Ethereum’s share might drop to 35-40% as sector-specific chains capture more value. We’re moving toward a multi-chain future where different networks specialize in different tasks, rather than one chain trying to do everything.
Cross-chain interoperability is the next frontier. Tools like Chainlink’s CCIP are enabling billions in cross-chain positions, allowing assets to move freely between networks. This reduces the friction of choosing a single home for your funds. Instead of locking capital in one place, users can diversify across multiple chains, spreading risk and optimizing for yield.
Frequently Asked Questions
What exactly is Total Value Locked (TVL)?
TVL is the total dollar value of all assets currently deposited into smart contracts within a blockchain's DeFi ecosystem. It serves as a primary indicator of liquidity and user trust in a particular network or protocol. Think of it as the total deposits in a bank branch, but for decentralized applications.
Why is Ethereum still dominant despite high fees?
Ethereum offers the highest level of security and decentralization among major public blockchains. Many institutional investors and large holders prioritize security over low fees, especially for long-term storage of value. Additionally, its mature developer ecosystem and vast array of integrated tools create a network effect that is hard to break.
Can TVL be manipulated or inflated?
Yes. Protocols can artificially boost TVL by offering excessive incentives that attract short-term farmers rather than long-term users. Double-counting assets across multiple layers or using non-circulating tokens can also skew numbers. Always look for "clean TVL" metrics that exclude incentivized liquidity and focus on organic usage.
Which blockchain has the lowest transaction fees?
Solana typically boasts the lowest fees among major networks, averaging around $0.00025 per transaction. TRON is also very cheap for stablecoin transfers, often costing pennies or less. Layer-2 solutions like Base and Arbitrum also offer significantly lower fees than Ethereum mainnet, usually under $0.10.
How does regulatory news affect TVL distribution?
Regulatory clarity tends to attract institutional capital, boosting TVL on compliant networks. Conversely, sudden regulatory crackdowns can cause temporary dips as protocols adjust. For instance, the implementation of MiCA in Europe caused a short-term decline in TVL as projects updated their compliance measures, but it eventually stabilized the market.